
1.Before starting anything let’s just clear what actually DATA and what is data analysis?
- So basically data is just a summary of thousands of stories in which only a few of those stories make the data meaningful which further is used for the analysis but the main question that arises is what is data analysis.
- As we all know that data is everywhere, for instance, in spreadsheets, social media platforms, your sales pipeline, customer satisfaction surveys or feedback, customer support tickets, and much more.
- In our modern information age, the data is created at a blinding speed and when the data is analyzed correctly this can become a company’s most valuable asset. But some of it, you may not even know how to access.
2. How ORGANIZATIONS work?
- Businesses today need every edge and advantage they can get and use to boost their work and the company/organization. All thanks to obstacles like economic uncertainty, rapidly changing markets, finicky consumer attitudes, shifting political landscapes, and even global pandemics, businesses these days are working with slimmer margins for error.
- Companies that not just want to stay in business but also want to thrive focus on improving their odds of success by making smart choices. So the question might arise how these choices are made?
So the basic answer to that is that the organizations try to collect useful and actionable information as much as possible, then using it to make better-informed decisions!
- This strategy is nothing but common sense which is applied in personal life as well as in businesses. Nobody makes important sensitive driven decisions without first finding out what’s at stake, the possible outcomes, and the pros and cons. Similarly, no company that wants to succeed would make decisions based on ignorance or rough ideas. So the organizations need information, i.e. they need DATA.
- The discipline of data analysis enters into the picture when there is a need for some sort of data and this article is a short informative piece on data analysis that how it works, its different methods, types, and processes.
3.Now, let us talk about what is Data Analysis.
Many organizations, groups, and experts have their own different ways to approach data analysis out of which most of them can be distilled into a one-size-fits-all definition.
Data analysis is the process of:-
- Cleaning,
- Analyzing,
- Interpreting,
- Processing raw data, and extracting actionable, relevant information that helps businesses to discover valuable insights that drive smarter and more effective business decisions

The procedure of analyzing data helps in reducing the risks inherent in decision making by providing useful insights and statistics which are often presented in tables, charts, images, and graphs.
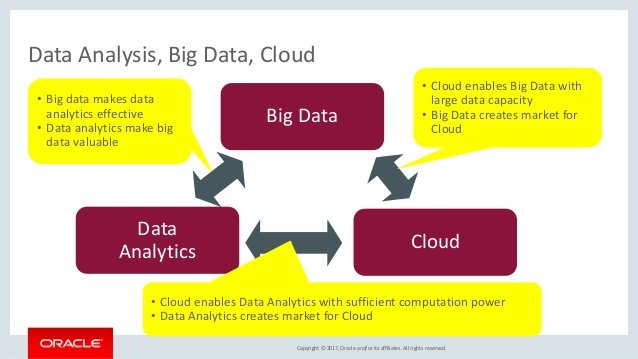
“Big data” is a very common term used these days brought up in discussions about data analysis and this analysis plays a crucial role in processing big data into some sort of useful information.
Data analysis has multiple approaches, diverse techniques which are used in different business, science, and social science domains. Different types of data analysis tools are used to extract useful information from businesses to make the data analysis process easier.
It is common to hear the term data analytics in business, which is the science or discipline that encircles the whole process of data management and some data analyses appear to be fixed and linear. Data analytics is not just the data analysis itself, but also data collection, storage, organization, and tools and techniques used to deep-dive into the data, it is also used to communicate the results, for instance, data visualization tools.
Let’s talk about an example that could be the algorithms that are embedded into various software platforms, including apps. These algorithms are the final product of data analysis that have emerged from the disorderly work of developing and refining a data analysis so that it can be further converted into an algorithm.
A study includes;
- the development of questions
- the designing of the data collection processes
- the collection
- the analysis
- the interpretation of the data.
Because a data analysis presumes that the data have already been collected, it includes the development and filtration of a question and the process of analyzing and then interpreting the data.
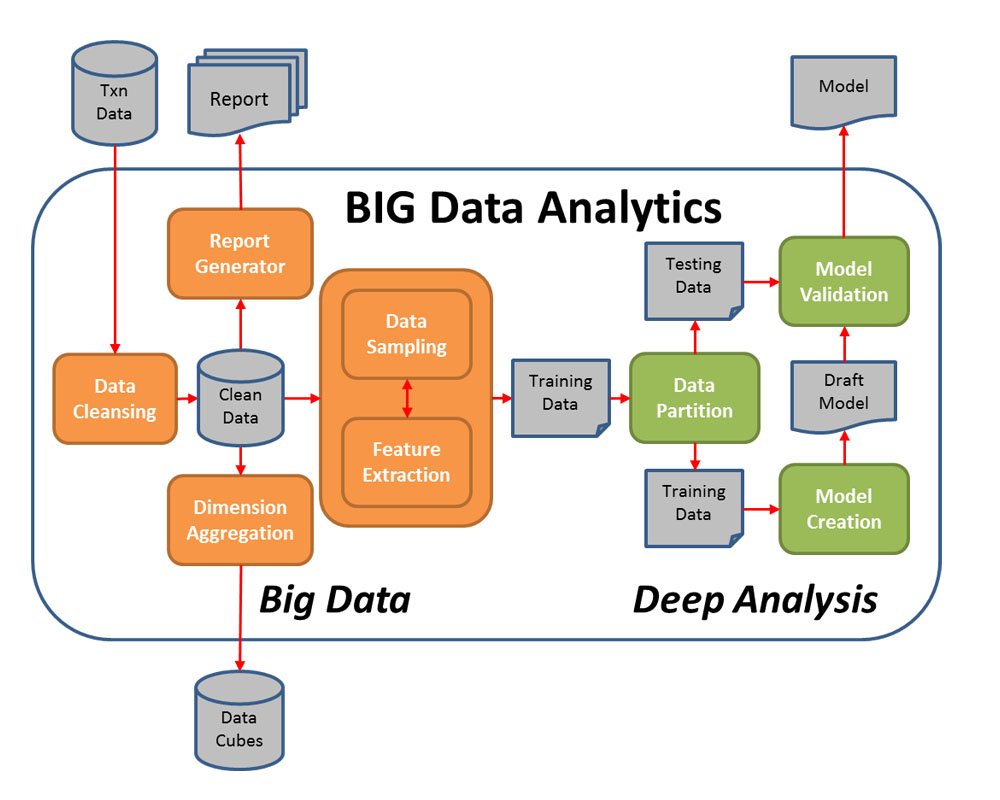
4.As of now, the basic concept of Data Analysis might be clear so let’s go further on how the analysis processes work. So here are the seven different steps used to analyze the data.
- Data Requirements
- Data Collection
- Data Processing
- Data Cleaning
- Exploratory Data Analysis
- Modeling and Algorithm
- Data Product
Data requirements
The very first step is to make clear objectives that will help determine the type of data that you’ll need to collect and analyze. The data is the basic need for the analysis as further processes will be done over that data as per the requirements of those who are directing those analyses. The data will be collected on a general type of entity known as an experimental unit (e.g. individual or group of persons), with some specific variables such as age and income. Data can either be numerical or categorical i.e. a text label for numbers.
Data collection
Data is everywhere and is collected from a variety of sources and you’ll want to bring it all into one place ready for analysis. Whether the data is quantitative or qualitative, Excel is a great platform to store data, or data sources could be connected to your analysis tools via APIs and integrations.
The requirements may be communicated by analysts such as Information Technology personnel within an organization. The data can also be collected from online sources, through interviews, or by reading documentation, or even from the sensors in the environment, recording devices, traffic cameras, or even satellites.
Data processing
When the data is initially obtained it must be processed or organized for analysis. For example, placing the data into rows and columns in a table format generally known as structured data for further analysis, through the use of spreadsheets or statistical software.
Data cleaning
The unstructured data need to be cleaned before analyzing it to have accurate results. Get rid of special characters, stop words (and, too, she, they), punctuation marks, duplicates, HTML tags, etc. When the data is processed and organized, still there might be chances that the data is incomplete or contains some errors. Cleaning of data helps in the prevention of errors. The types of data problems like identifying inaccuracy of data, record matching, and overall quality of existing data, deduplication, and column segmentation can also be identified through a variety of analytical techniques.
Exploratory data analysis
Once the datasets are cleaned, the next step comes is analyzing data. A variety of techniques are applied such as exploratory data analysis to understand the messages contained within the obtained data. The process may result in additional data cleaning. Data visualization is one of the techniques used to examine the data in a graphical format to obtain insights, within the data.
Modeling and algorithms
Mathematical formulas known as algorithms may be applied to the data in order to identify relationships among the variables. In common terms, models are developed to evaluate a specific variable based on another variable contained within the dataset, with some residual error depending on the implemented model’s accuracy (e.g., Data = Model + Error).
Data product
A data product is a computer application that is used to take the data input and generate its simultaneous outputs. This can be based on a model or an algorithm.
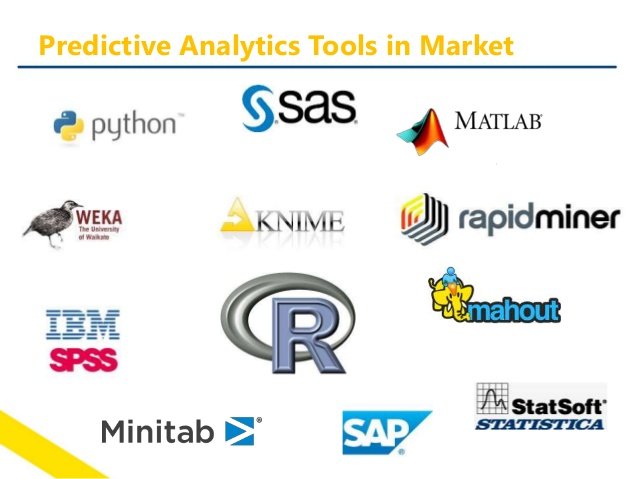
5.What are the Data Analytics Tools
There are different data analysis tools available depending on your technical skills, budget, and type of data you want to analyze. They’re also a great way of speeding up the manual and time-consuming data analysis to make fast decisions.
Here are some top data analysis tools that can help you perform text analysis to data visualization
- MonkeyLearn
- KNIME
- RapidMiner
- Microsoft Excel
- Tableau
- R
- Python
6.Types of data analysis
- Descriptive Analysis
- Diagnostic Analysis
- Predictive Analysis
- Prescriptive Analysis
Descriptive Analysis
Descriptive data analysis looks at past data and tells what happened and is often used while tracking Key Performance Indicators, revenue, sales leads, etc.
Diagnostic Analysis
This analysis aims to determine things that why they are happening no matter it is positive or negative, diagnostic analysis is done to figure out the reason. A business may see that leads increased in the month of November then use this analysis to determine which marketing efforts contributed the most.
Predictive Analysis
Predictive data analysis predicts the future in this type of research derived from past data. For instance, to predict the coming year’s revenue, the data from previous years will be taken under consideration and analyzed. If revenue has gone up 30% every year for consecutive years, then we can predict that revenue for the next year will be 30% higher than the current year. Predictive analytics can be applied to other complicated issues like sales forecasting, management of risk, or qualifying leads.
Prescriptive Analysis
Prescriptive data analysis combines the information from the above 3 types of data analysis and forms a plan of action for decision. Data-driven choices are made here.
7.Free software for data analysis
- DevInfo
- ELKI
- KNIME
- Orange
- Pandas
- PAW
- R
- ROOT
- SciPy
- Julia
8.Why Is Data Analysis important?
Data analysis is trending these days, and it is really helpful to businesses as it helps in improving their products and services, as well as their overall brand image. By analyzing the different types of data, i.e. whether structured data or unstructured data, it becomes easy to discover detailed insights about the customers and a better understanding of their needs.
Using data correctly can help in various aspects of the business, ranging from defining effective product strategies and detecting growth opportunities to improving business processes, and deciding where to focus their investments on.
Instead of relying on intuition, guess, or experience, analyzing data provides some solid evidence in order to support decisions.
Let’s talk about the product teams they often analyze their customer’s feedback in order to understand the interaction of the customer with their product, what they’re upset with whether it’s the quality/quantity/cost, and what additional new features they’d like to see. This then translates the insight into UX improvements with some new features, and enhanced functionalities.
Data analysis is also helpful in analyzing the weaknesses and strengths of your competitor which further can help in uncovering the opportunities for improvement for them. Analyzing the online reviews about your competitor to get to know about the answer to some common questions like what do customers love or hate about your competitors’ products or services?
9.What are Data Analytic methods?
The two terms data analysis methods and data analysis techniques are somewhat identical which somehow complicates the matter when people throw in the previously discussed data chosen by some of the professionals. A distinction between different types of data analysis that exist needs to be established, and in the different ways, it uses.
Although there are multiple data analysis methods available that fall into one of two primary types.
- Qualitative Data Analysis
The method of qualitative data analysis derives data in terms of words, pictures, symbols, and observations and there is no such use of statistics in this method. Different methods of qualitative data analysis are:
- Content Analysis, which is used to analyze the behavioral and verbal data.
- Narrative Analysis, from interviews, diaries, surveys.
- Grounded Theory, to develop causal explanations by studying and extrapolating from one or more past cases.
- Quantitative Data Analysis
In this analysis, the raw data is collected from scratch which is further processed into numerical data. Quantitative analysis different methods include:
- Hypothesis Testing, for assessing the truth of a given theory for a data set.
- Mean determines a subject’s overall trend by dividing the sum of a list of numbers by the total number of items on the list.
- A study on few samples is done that uses a large group of people which is further analyzed. The results attained are represented on the entire body.
10. What are the FIVE core activities of data analysis:
Stating and refining the question, exploring the data, building formal, statistical models, interpreting the results, communicating the results
These activities can happen at any time of the day, chances are that you might get all these activities in a single day, or sometimes it might take a couple of months because of dealings with a large project. But it is important to understand the whole framework that is used to approach each of these activities at the initial stage and chances are that you might engage in while doing data analysis, every aspect of the entire process can be approached through an iterative process known as the “epicycle of data analysis”. It is important to engage in the following steps for analyzing:
Step 1: Set expectations
First and foremost set an expectation.
Step 2: Test expectations:
Then collect the information or data, compare it to your expectations, and if the expectations match then it is fine else if it doesn’t match then follow the 3rd step.
Step 3: Revise your expectations and work on fixing the data, so that your data and your expectations could match.
The iteration of these steps is called the “epicycle of data analysis. As you go through every stage of analysis, you will need to go through the epicycle to continuously refine your question, your exploratory data analysis, your formal models, your interpretation, and your communication.
11.Techniques for analyzing quantitative data
- Make sure to check the raw data for anomalies prior to performing analysis,
- Cross-check the important calculations, like verifying columns of data that are formula driven,
- Confirm that the main totals are the sum of subtotals,
- Check relationships between the numbers related in a predictable way, like ratios over time,
- Normalize numbers to make comparisons easier by analyzing the amounts per person or as an index value relative to a base year,
- Break problems into different parts by analyzing factors leading to the results, like DuPont’s analysis of return on equity.
The descriptive statistics are obtained by the analysts working on data for those variables that are under the examination, for instance, mean, median, and standard deviation. To see how every single value clusters around when they are distributed the mean analysis is done on the key variables.
12.Barriers to effective the data analysis
There is some sort of barriers that might exist among the analysts while performing the data analysis distinguishing fact from opinions, cognitive biases, and innumeracy that are challenges to sound data analysis.
13.Confusing facts and opinions
To work on the effective analysis relevant facts are needed in order to support a formal opinion, answer the questions, test hypotheses, or get conclusions. Any person involved in the analysis should agree upon them as the facts by definition are irrefutable. An example of this is, the auditor of a public organization must give a formal opinion of his on the financial statements of those public-traded corporations that whether they are fairly stated in all material respects or not. These type of opinions requires extensive analysis of fact-based data and evidence to support those opinions. There might be possibilities of erroneous opinions while making a leap in between them.
14.Education
Educators have access to a data system to analyze the data of every single student. This type of data is presented in the form of over-the-counter data format such as, supplemental documentation, embedding labels, and a help system and making key package/display and content decisions to improve the accuracy of educators’ data analyses.
15.Initial data analysis
The key difference between the initial data analysis phase and the main analysis phase is that in the initial data analysis one refrains at answering the original research question. This phase of initial data analysis is guided by the following 4 questions:
- Quality of data
The quality of the data is what needed and used throughout the analysis process so it should be checked as early as possible. Quality of data can be assessed in multiple ways, using different types of analysis like the frequency counts, mean, median, standard deviation, kurtosis, skewness, frequency histograms, and normal imputation is needed.
Analysis of extreme observations requires outlying of the observations in the data to be analyzed to check if there is any disturbance in the distribution.
Correction and Comparison of differences in coding schemes where the variables are compared with the other coding schemes of variables external to the data set and are corrected if coding schemes are not comparable.
The choice of analyses of the initial data analysis phase depends on the analyses of the main analysis phase.
- Quality of measurements
The quality of the measurements is checked at the initial data analysis phase when there is not much focus. Constant checks on the structure of measurement instruments and the structure reported in the literature should be there to see if there is any sort of similarity.
The two different ways to assess measurement quality are mentioned below:
- Confirmatory factor analysis
Analysis of internal consistency gives an indication of the reliability of a measurement instrument. While this analysis is focused on, one inspects the variances of the items and the scales, i.e., the Cronbach’s α of the scales, and the change in the Cronbach’s alpha when an item would be deleted from a scale.
- Initial transformations
The next step is to impute missing data right after the quality of measurements is completed. Initial transformations of one or more variables are performed during the main analysis phase.
Possible transformations of variables are:
- Square root transformations
- Log-transformations
- Inverse transformations
- Make categorical (ordinal/dichotomous)